Data Visualization UI/UX Design Services
Engaging Data Visualization Designs
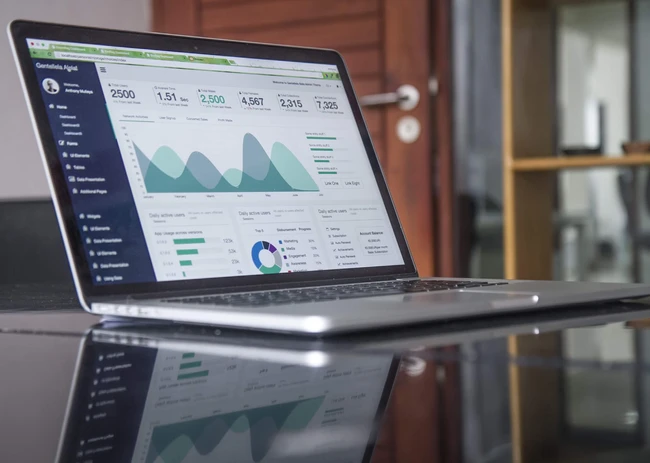
Flatirons Development specializes in creating compelling and informative data visualization designs to help businesses make data-driven decisions.
Request a Free Estimate
Fill out the form below to schedule a call.

Our Data Visualization UI/UX Design Services

Data Visualization UX Design
Crafting intuitive and visually appealing user experiences for effective data visualization applications.

Data Visualization UI Design
Designing user interfaces that make complex data easy to understand and interact with for data visualization projects.

Data Analysis Services
Leveraging data insights to uncover patterns, trends, and insights that drive informed decision-making.

Business Intelligence Solutions
Implementing BI tools and strategies to transform raw data into actionable insights for improved business performance.

Data Warehousing Services
Creating robust data warehousing solutions for efficient storage, retrieval, and analysis of large volumes of data.

Query Optimization Services
Enhancing database performance through fine-tuning queries and indexes for improved efficiency.

Data Visualization UI Design
Crafting visually appealing and informative data visualizations to help you make sense of complex data sets.

Data Visualization UX Design
Enhancing user experience by ensuring that the data visualizations are intuitive and user-friendly.

Data Visualization Prototyping
Creating interactive prototypes to test and iterate on data visualization concepts before final implementation.

Design Systems for Data Visualization
Establishing design systems that maintain consistency and scalability across various data visualization projects.

Data Analysis
Leveraging data analytics tools and techniques to derive insights and trends from your data.

Business Intelligence Services
Implementing BI solutions to transform raw data into actionable insights for informed decision-making.
Our record speaks for itself.
Types of Data Visualization Solutions we Create

Real-Time Analytics Dashboard
Monitor and analyze data in real-time with interactive visualizations on a dynamic dashboard.

Custom Data Reporting Tool
Create tailored reports that highlight key metrics and trends important to your business.

Data Visualization Mobile App
Access and explore data insights on the go through a user-friendly mobile application.

Predictive Analytics Platform
Utilize AI and machine learning to forecast trends and make informed data-driven decisions.

Geospatial Data Mapping Software
Visualize location-based data with mapping tools for in-depth spatial analysis.

Data Visualization for Business Intel
Create interactive dashboards for business intelligence reporting and analysis.

Healthcare Data Analytics Platform
Enable healthcare providers to analyze patient data for insights and improved care outcomes.

E-commerce Sales Visualization Tool
Visualize sales data to optimize marketing strategies and track performance metrics.

Interactive Data Charts
Create visually appealing charts and graphs that allow users to interact with the data for deeper insights.

Real-time Analytics Dashboard
Develop dashboards that display real-time analytics and key performance indicators for quick decision-making.

Data Visualization Mobile App
Build mobile apps that present data in a visually engaging way for on-the-go access.

Customizable Data Reports
Design reports that can be customized to showcase different data aspects based on user preferences.

Big Data Visualization
Implement visualization solutions for handling large volumes of complex data sets efficiently.

Data Storytelling Apps
Create applications that tell compelling stories through data visualization to engage users.

Predictive Analytics Tools
Develop tools that use predictive analytics to forecast trends through visually appealing displays.

Geospatial Data Mapping
Enable users to visualize location-based data through interactive and dynamic mapping features.
The reviews are in.
Our Process for Data Visualization Projects

01
Scoping
We have detailed discussions to understand your requirements, objectives, and challenges.
02
Proposal
We provide you with a proposal that outlines scope, timelines, required resources, and costs.
03
Contract
A contract formalizes our relationship and commitment to delivering the agreed-upon services.
04
Execution
We kick off the project by dedicating our resources to design and implement the software solution.A trusted partner for your business.

Our company is growing, and as we started looking to scale, we wanted a more efficient business model. We hired Flatirons Development to build a platform that would help connect talent with the right company.
Brian Bar
Founder and CEO

They deconstructed our idea and provided it back to us in an incredibly smart and accessible manner. Flatirons Development is constantly solving problems in both a visually stunning and intelligent way.
Storey Jones
Founder and CEO

With the help of Flatirons Development, we were able to launch a large update to our platform, introducing new innovative tools for our clients. The information was complex but Flatirons found creative ways to present it, making it feel simple and easy to understand.
Jeremy Zaborowski
Co-Founder & CTO

Flatiron's work optimized site design and flow. The creative lead at Flatirons Development demonstrated exceptional UX know-how, integrating usability and design to deliver a powerful product. The client came out of the engagement with a wider understanding of the most important platform features.
Heidi Hildebrandt
Director of Product

Our company is growing, and as we started looking to scale, we wanted a more efficient business model. We hired Flatirons Development to build a platform that would help connect talent with the right company.
Brian Bar
Founder and CEO

They deconstructed our idea and provided it back to us in an incredibly smart and accessible manner. Flatirons Development is constantly solving problems in both a visually stunning and intelligent way.
Storey Jones
Founder and CEO

With the help of Flatirons Development, we were able to launch a large update to our platform, introducing new innovative tools for our clients. The information was complex but Flatirons found creative ways to present it, making it feel simple and easy to understand.
Jeremy Zaborowski
Co-Founder & CTO

Flatiron's work optimized site design and flow. The creative lead at Flatirons Development demonstrated exceptional UX know-how, integrating usability and design to deliver a powerful product. The client came out of the engagement with a wider understanding of the most important platform features.
Heidi Hildebrandt
Director of Product

Our company is growing, and as we started looking to scale, we wanted a more efficient business model. We hired Flatirons Development to build a platform that would help connect talent with the right company.
Brian Bar
Founder and CEO

They deconstructed our idea and provided it back to us in an incredibly smart and accessible manner. Flatirons Development is constantly solving problems in both a visually stunning and intelligent way.
Storey Jones
Founder and CEO

With the help of Flatirons Development, we were able to launch a large update to our platform, introducing new innovative tools for our clients. The information was complex but Flatirons found creative ways to present it, making it feel simple and easy to understand.
Jeremy Zaborowski
Co-Founder & CTO

Flatiron's work optimized site design and flow. The creative lead at Flatirons Development demonstrated exceptional UX know-how, integrating usability and design to deliver a powerful product. The client came out of the engagement with a wider understanding of the most important platform features.
Heidi Hildebrandt
Director of Product
Cutting-Edge Technologies for Data Visualization Design

Power BI
Power BI is a business analytics service by Microsoft. It provides interactive visualizations and business intelligence capabilities with an interface simple enough for end users to create their own reports and dashboards.
Tableau
Tableau is a powerful data visualization tool used in the business intelligence industry for data analysis that helps in simplifying raw data into a very easily understandable format.
Python
Python's extensive libraries and frameworks streamline the development of backend services, crucial for handling complex financial computations and big data analytics in fintech solutions.
R
R is a programming language and free software environment for statistical computing and graphics, highly favored among statisticians and data miners.
JavaScript
JavaScript is a versatile programming language that is one of the core technologies of the World Wide Web. It enables dynamic interactivity on websites when applied to an HTML document.
GraphQL
GraphQL is a query language for APIs and a runtime for executing those queries with existing data. It provides a more efficient, powerful, and flexible alternative to REST and is utilized heavily in healthcare applications for data retrieval.
PostgreSQL
PostgreSQL is a robust, open-source relational database management system, known for its reliability, feature robustness, and performance.
AWS
Amazon Web Services (AWS) offers reliable, scalable, and inexpensive cloud computing services, supporting the deployment and management of applications in the cloud.
Power BI
Power BI is a business analytics service by Microsoft. It provides interactive visualizations and business intelligence capabilities with an interface simple enough for end users to create their own reports and dashboards.
Tableau
Tableau is a powerful data visualization tool used in the business intelligence industry for data analysis that helps in simplifying raw data into a very easily understandable format.
D3.js
D3.js is a JavaScript library for producing dynamic, interactive data visualizations in web browsers.
Looker
Looker is a data analytics and business intelligence platform that helps organizations explore, analyze, and share insights from their data.People talk about us.
Our Engagement Models for Data Visualization


Project Outsourcing
For comprehensive execution of your data visualization UI/UX design project, consider outsourcing to Flatirons Development.View MoreStaff Augmentation
Scale your team with skilled professionals for your data visualization UI/UX design project through staff augmentation services.View MoreProject Outsourcing
For end-to-end execution of your data visualization UI/UX design project, consider our project outsourcing services.View MoreStaff Augmentation
Augment your existing team with skilled professionals for your data visualization UI/UX design needs.View MoreThe top 1% of design & engineering talent.
Why Choose Flatirons Development for Data Visualization UI/UX Design?

Tailored Data Visualization Designs

Expert UI/UX Team

Interactive User Experiences

Data-Driven Design Approach

Seamless Integration

Expertise in Data Visualization

Custom UI/UX Design Solutions

Innovative Design Techniques

Collaborative Approach

Responsive and Scalable Designs

Emphasis on User Engagement

Data-Driven Design Decisions
Benefits of Data Visualization UI/UX Design
Explore the advantages of integrating advanced UI/UX design into data visualization projects to enhance data understanding and decision-making.

Interactive Data Representation
Our data visualization services create interactive and engaging data representations that are easy to understand and navigate.
User-Centric Design
We prioritize user experience in our data visualization designs, ensuring intuitive interfaces and seamless interactions.
Insightful Analytics
Our designs enable deep insights from complex datasets, empowering informed decision-making and strategic actions.
Customized Dashboard Solutions
We craft tailored dashboard solutions that display key metrics and trends for quick and effective data-driven decisions.
Visual Storytelling
Our designs incorporate storytelling elements to convey complex data in a visually compelling and easy-to-understand manner.
Enhanced Data Accessibility
We focus on making data easily accessible and comprehensible to all users, regardless of their technical expertise.
Cross-Platform Compatibility
Our designs ensure compatibility across various platforms, allowing seamless data visualization experiences on different devices.
Scalable Design Solutions
We provide scalable design solutions that grow with your data needs, adapting to evolving requirements and increasing data volumes.
Interactive Data Displays
Create engaging data visualizations that allow users to interact with and explore data in a meaningful way.
User-Centered Design
Design intuitive and user-friendly interfaces for data visualization that prioritize user needs and preferences.
Data Storytelling
Transform complex data sets into compelling stories that can be easily understood and interpreted by users.
Mobile Responsive Visualizations
Create responsive data visualizations that adapt seamlessly to various screen sizes, ensuring a consistent user experience across devices.
Enhanced Decision Making
Empower decision-makers with clear and insightful visualizations that support data-driven decision-making processes.
Performance Optimization
Optimize the performance of data visualizations to ensure fast loading times and smooth interactions for users.
Scalable Visual Solutions
Develop scalable data visualization solutions that can grow with your business needs and handle increasing data volumes.
Accessibility Compliance
Ensure data visualizations meet accessibility standards to provide inclusive experiences for users with disabilities.FAQs about Data Visualization UI/UX Design
Explore common questions and answers related to our UI/UX design services for data visualization projects.
What is data visualization and why is it important?
How can data visualization improve user experience (UX) design?
What tools and technologies do you use for data visualization projects?
Can you customize the design of data visualizations to match our brand's aesthetics?
How do you ensure data visualization projects are user-friendly and intuitive?
What is the process for creating interactive data visualization solutions?
Can you integrate data visualization solutions with our existing software or platforms?
What are some best practices for effective data visualization design?
What is data visualization and why is it important?
How can effective UI/UX design enhance data visualization?
What tools and technologies do you use for data visualization UI/UX design?
Can you customize data visualization solutions to meet specific business needs?
What are the benefits of investing in professional data visualization UI/UX design services?
How do you ensure data security and confidentiality in data visualization projects?
What is the typical process for developing data visualization solutions with a focus on UI/UX design?
How does data visualization UI/UX design contribute to actionable insights and business growth?
Read about Data Visualization UI/UX Design

The Top Nearshore Development Countries
Flatirons Development
Jan 17, 2024
Nearshore vs. Onshore Development Cost Comparison
Flatirons Development
Jan 17, 2024
Types of Nearshore Software Development Services
Flatirons Development
Jan 17, 2024
What Is Digital Product Design? The Ultimate Guide in 2026
Flatirons Development
May 12, 2024
The Importance of Accessibility in UX/UI Design
Andrés Palma
Jun 01, 2022
Haptic Feedback: Enhancing User Experience (UX) With Haptics
Flatirons Development
Feb 13, 2024
