Data Visualization Web Development Services
Engaging, performant web applications.
Flatirons Development helps businesses of all shapes and sizes create custom web applications on time and on budget.
Request a Free Estimate
Fill out the form below to schedule a call.


Our Data Visualization Web Development Services


Data Analysis
Our expert team provides in-depth data analysis to derive valuable insights and make informed business decisions.


Query Optimization
We optimize database queries for improved performance and efficiency in processing data.

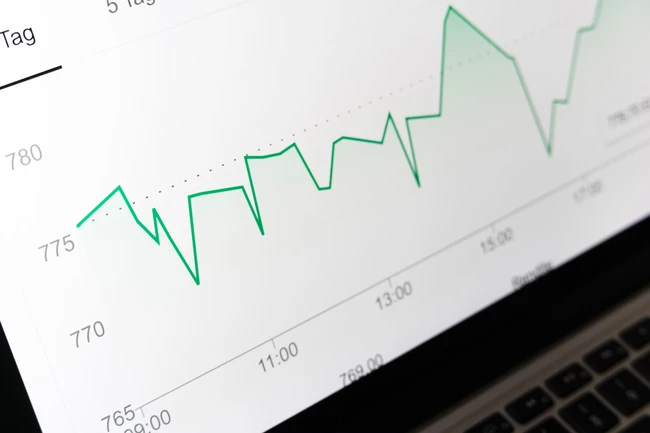
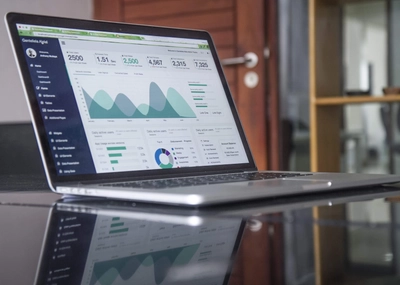
Data Visualization
Transform raw data into visually appealing charts, graphs, and interactive dashboards for better understanding and decision-making.

Business Intelligence
Utilize advanced analytics tools and techniques to gather, analyze, and visualize business data for strategic insights.


Database Migrations
Efficiently migrate data between different database systems while ensuring data integrity and minimal downtime.

Data Warehousing
Design and implement data warehousing solutions to securely store and manage large volumes of structured and unstructured data.
Our record speaks for itself.
Types of Web Apps we Create


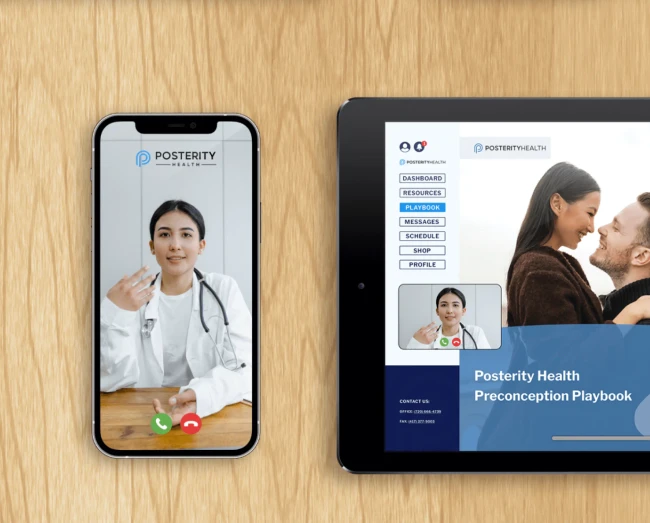
Interactive Data Dashboards
Visualize your data in interactive dashboards to gain insights at a glance.


Real-time Data Visualization
Monitor and analyze your data in real-time with dynamic visualizations.


Custom Data Mapping Tools
Create custom data maps to display geographical data with precision.


Data Analysis Toolkits
Utilize advanced data analysis tools to extract valuable insights from your datasets.


Smart Data Visualization Widgets
Integrate smart data visualization widgets to enhance user engagement.


Predictive Data Visualization
Leverage predictive analytics for data visualization to anticipate trends.


Data Visual Storytelling
Craft compelling stories with your data using interactive visualizations.


Mobile Data Visualization Apps
Access and visualize your data on-the-go with mobile data visualization apps.


Augmented Reality Data Visualization
Experience data in an immersive way with AR data visualization tools.


Accessible Data Visualization Solutions
Make your data accessible to all users with inclusive data visualization solutions.
The reviews are in.
Our Process for Web Projects


01
Scoping
We have detailed discussions to understand your requirements, objectives, and challenges.


02
Proposal
We provide you with a proposal that outlines scope, timelines, required resources, and costs.


03
Contract
A contract formalizes our relationship and commitment to delivering the agreed-upon services.


04
Execution
We kick off the project by dedicating our resources to design and implement the software solution.A trusted partner for your business.


Our company is growing, and as we started looking to scale, we wanted a more efficient business model. We hired Flatirons Development to build a platform that would help connect talent with the right company.
Brian Bar
Founder and CEO


They deconstructed our idea and provided it back to us in an incredibly smart and accessible manner. Flatirons Development is constantly solving problems in both a visually stunning and intelligent way.
Storey Jones
Founder and CEO


With the help of Flatirons Development, we were able to launch a large update to our platform, introducing new innovative tools for our clients. The information was complex but Flatirons found creative ways to present it, making it feel simple and easy to understand.
Jeremy Zaborowski
Co-Founder & CTO


Flatiron's work optimized site design and flow. The creative lead at Flatirons Development demonstrated exceptional UX know-how, integrating usability and design to deliver a powerful product. The client came out of the engagement with a wider understanding of the most important platform features.
Heidi Hildebrandt
Director of Product
Our company is growing, and as we started looking to scale, we wanted a more efficient business model. We hired Flatirons Development to build a platform that would help connect talent with the right company.
Brian Bar
Founder and CEO
They deconstructed our idea and provided it back to us in an incredibly smart and accessible manner. Flatirons Development is constantly solving problems in both a visually stunning and intelligent way.
Storey Jones
Founder and CEO
With the help of Flatirons Development, we were able to launch a large update to our platform, introducing new innovative tools for our clients. The information was complex but Flatirons found creative ways to present it, making it feel simple and easy to understand.
Jeremy Zaborowski
Co-Founder & CTO
Flatiron's work optimized site design and flow. The creative lead at Flatirons Development demonstrated exceptional UX know-how, integrating usability and design to deliver a powerful product. The client came out of the engagement with a wider understanding of the most important platform features.
Heidi Hildebrandt
Director of Product
Our Web Development Technologies


Power BI
Power BI is a business analytics service by Microsoft. It provides interactive visualizations and business intelligence capabilities with an interface simple enough for end users to create their own reports and dashboards.


Tableau
Tableau is a powerful data visualization tool used in the business intelligence industry for data analysis that helps in simplifying raw data into a very easily understandable format.

Python
Python's extensive libraries and frameworks streamline the development of backend services, crucial for handling complex financial computations and big data analytics in fintech solutions.

R
R is a programming language and free software environment for statistical computing and graphics, highly favored among statisticians and data miners.People talk about us.
Our Web Development Engagement Models


The top 1% of design & engineering talent.
Why Choose Flatirons Development for Web Development?


Expertise in Data Visualization


Customized Solutions

Interactive Dashboards


Scalable Solutions


Data-driven Decision Making

Experienced Team


Benefits of Custom Web Development
Explore some of the benefits of creating a custom web application.


Interactive Visualizations
Create engaging and interactive data visualizations that allow users to explore and understand complex information easily.

Data-driven Decision Making
Empower your organization with data-driven insights derived from powerful visual representations of your data.
Custom Dashboards
Build custom dashboards tailored to your specific needs, providing a centralized view of key metrics and KPIs.
User Engagement
Enhance user engagement through visually appealing and intuitive data visualizations that captivate your audience.
Cross-platform Compatibility
Ensure seamless data visualization experiences across various devices and platforms for wider accessibility.
Performance Optimization
Optimize the performance of your data visualization web applications for faster loading times and smooth interactions.
Data Security
Implement robust security measures to protect sensitive data displayed in your visualizations and ensure compliance.Scalable Solutions
Develop scalable data visualization solutions that can accommodate growing data volumes and expanding user needs.FAQs about Custom Web Development
Explore common questions and answers related to building a custom web application with Flatirons Development.

